
-
MA.5.GR.4 Geometric Reasoning
Plot points and represent problems on the coordinate plane.
MA.5.GR.4.2
Represent mathematical and real-world problems by plotting points in the first quadrant of the coordinate plane and interpret coordinate values of points in
the context of the situation.
Example: For Kevin’s science fair project, he is growing plants with different soils. He plotted the point (5, 7) for one of his plants to indicate that the plant grew 7 inches by the end of week 5.Benchmark Clarifications:
Clarification 1: Coordinate planes include axes scaled by whole numbers. Ordered pairs contain only whole numbers.Purpose and Instructional Strategies
The purpose of this benchmark is for students to interpret coordinate values plotted in mathematical and real-world contexts. Students have been plotting and interpreting numbers on a number line since Kindergarten. Students’ first experience with interpreting points plotted on a coordinate plane is in Grade 5, which leads to the foundational understanding needed throughout middle school. An example of interpreting coordinate values of points in a mathematical context could be identifying points of a rectangle plotted on the coordinate plane.
An example of interpreting coordinate values of points in a real-world context could look like the example in the benchmark description. In this real-world example, students would interpret that each axis represents a variable describing a situation. The 𝑥 −axis represents number of weeks and the 𝑦 −axis represents plants’ heights in inches.
During instruction, teachers should provide plenty of opportunities for students to both plot and interpret ordered pairs on a coordinate plane. Teachers should connect the expectations of this benchmark with MA.5.GR.4.1 by having students represent the points plotted on two-column tables as well (MTR.4.1, MTR.7.1).
In real-world contexts teachers should allow students the flexibility to decide which variable is represented by x and which is represented by y. Students may be encouraged to explain their preference.
During instruction, students should be given the flexibility to decide how to scale their graphs for a given real-world context. Students may be encouraged to explain their preference.
Common Misconceptions or Errors
Students can confuse the 𝑥 − and 𝑦 − values in an ordered pair and move vertically along the y-axis before moving horizontally along the x-axis. For example, they may mean to plot and label the ordered pair (2, 4), but plot and label (4, 2) instead.
Some students may not understand what an 𝑥 − or 𝑦 − coordinate value of 0 represents. During instruction, students should justify why ordered pairs with a 0 will plot on the 𝑥 −axis or 𝑦 −axis.
Instructional Tasks
Instructional Task 1
Lukas can make four bracelets per hour and he will work for five hours. Make a two-column table where the first column contains the numbers 1, 2, 3, 4, 5 indicating the number of hours worked, and the second column shows how many total bracelets he has made in that many hours. Plot points on the coordinate plane to represent your table, where the 𝑥 − coordinate represents the number of hours worked and the 𝑦 − coordinate represents the number of bracelets made.
Instructional Items
Instructional Item 1
The map below shows the location of several places in a town.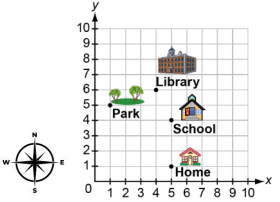
The fire department is 2 blocks north of the library. What ordered pair represents the location of the fire department?
e. (4, 2)
f. (2, 4)
g. (4, 8)
h. (8. 4)
Instructional Item 2
Deanna is plotting a square on the coordinate plane below.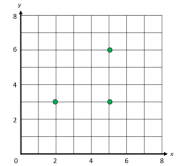
What ordered pair would represent the fourth vertex?
a. (6, 2)
b. (2, 6)
c. (2, 0)
d. (0, 2)
Select a School...
Select a School
- Apalachee Elementary
- Astoria Park Elementary
- Bond Elementary
- Buck Lake Elementary
- Canopy Oaks Elementary
- Chaires Elementary
- Conley Elementary
- DeSoto Trail Elementary
- Gilchrist Elementary
- Hartsfield Elementary
- Hawks Rise Elementary
- Kate Sullivan Elementary
- Killearn Lakes Elementary
- Oak Ridge Elementary School
- Pineview Elementary
- Riley Elementary
- Roberts Elementary
- Ruediger Elementary
- Sabal Palm Elementary
- Sealey Elementary
- Springwood Elementary
- W.T. Moore Elementary
- Cobb Middle
- Deerlake Middle
- Fairview Middle
- Griffin Middle
- Montford Middle
- Nims Middle
- Raa Middle
- Swift Creek Middle
- Chiles High
- Godby High
- Leon High
- Lincoln High
- Rickards High
- SAIL High
- Fort Braden School K-8
- Woodville Pre K-8
- Everhart
- Ghazvini Learning Center
- LCVS
- Early Childhood Programs
- Dining Services
- Student Admissions
- Transportation & Buses
- LCS - 20223 Night of Celebration
- LCS - 2025 Graduation
- ChooseLCS
- Cascade
- Z_New Subsite 054